
One Jump, or Several?
Ongoing research. This is an experimental result from active work, not a settled conclusion. The numbers are what we measured and the method is described so you can judge it, but the programme is still running and later experiments may revise what it means.
A note on the language in these records. This is a working laboratory notebook for research into training AI models more cheaply and efficiently, so you will read that an approach did not work, that a result did not hold up, or that one method was worse than another. That is the research doing its job, not a verdict on the engineering we deliver to clients. Ruling an approach out is how the search narrows, and these are the pages that teach us the most: nearly every technique we now rely on came from understanding why something else fell short. Testing our own ideas at least as hard as anyone else's is the point of publishing them. More about this programme and why we run it.
Part of a bigger question: What actually happens at the moment a model learns? – It builds machinery rather than selecting it, working through the task in a reproducible order and trying a simpler wrong rule on the way. The visible training curve cannot tell you which is happening.
In plain English
What we asked. The sudden improvement looks like a single jump on a graph. We zoomed in far enough to see whether it really is one.
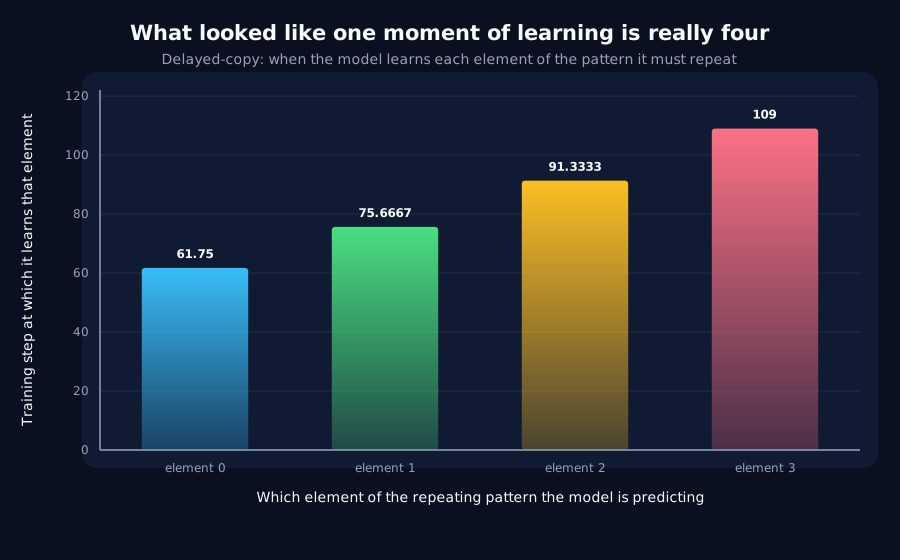
What we found. It is four, about sixteen steps apart, and they happen in a consistent order determined by which part of the pattern the model is predicting. The order repeats across independent runs at a correlation of +0.983, which is close to exact.
Why it matters. A curve that looks like one event at normal resolution is four events at high resolution. Anything that treats the jump as a single moment, including several of our own earlier measurements, is averaging over structure that is really there.
The rest of this page is the technical record: the design, every number, and the limits. It is written for a reviewer, and you do not need it to have understood the result above.
New here? How to read a research record
- Start at the verdict. Every record states, before the experiment was run, what result would have made us abandon the idea. That is the "kill test". Then it says whether the test fired. Nothing gets reinterpreted after the fact.
- Numbers in square brackets are uncertainty.
23.4 [18.1, 28.7]means our best estimate is 23.4 and the true value is probably somewhere in that range. If a range includes zero, we cannot claim an effect. - Results that rule an idea out are kept. Roughly half of what is published here says an approach did not work, including plenty of our own. Those pages are the output, not a shortfall: knowing which direction is a dead end is what lets the next experiment go somewhere better, and most of what we now rely on came out of understanding why something else fell short. Work that only publishes what worked is not measuring anything.
- Read the Limits section. Every record ends with what it does not show. It is the most honest part of any experiment and usually the shortest.
- Pro tip: the figures near the top are designed to carry the result on their own. If you read nothing else, read the caption under each one, which says what it shows and what to take from it.
EXPLORATORY. Not a preregistered study. Local CPU, 10 training runs, no GPU, no cost.
Program v2 tier 3, items D2 (per token class) and A12 (per position), which are the same measurement applied to two ways of slicing the same runs. Decisive computation: analysis/acquisition_microscope.pyanalysis/acquisition_microscope.jsonpython analysis/acquisition_microscope.py in about ten minutes on a throttled laptop CPU.
QUALIFIED 2026-08-26 by N11. The stagger-over-width ratios below are measured on accuracy, which is an argmax, and an argmax widens a class's transition because a class cannot move until its correct token overtakes its rival. Measured in bits per token on the same runs, the ratio falls from1.442to0.706ondelayed-copyand from0.417to0.174ondispatch-copy-8lag, both paired differences excluding zero. **The acquisition ordering reported here is untouched: it remains+0.983and+0.910consistent across seeds. The separation is roughly halved without the threshold**, so "one jump is really four" is substantially a statement about when each element wins the argmax. The original text below is unchanged.
The question, and why it matters now
Every measurement this project has made of the transition treats it as one thing: accuracy averaged over every scored position jumps from chance to ceiling. That average could be hiding a staircase.
It matters because D3 closed the control programme by showing the transition's timing cannot be steered. Structure inside the transition would be a different handle, and the program has none.
Kill test: all classes move together within a few steps.
"A few steps" is not scale-free, so it is made so: a stagger between classes counts only if it is large relative to how long a single class takes to transition. Two classes separated by 5 steps mean nothing if each takes 60 steps to cross.
Result 1: per position, there is a staircase, and it is the same one every time
delayed-copy, 13 scored positions, five seeds:
| Measure | Value |
|---|---|
| Stagger between classes | 75.0 steps |
| A single class's own width | 52.0 steps |
| Stagger / width | 1.44 |
| Order consistency across seeds | +0.983 |
The classes resolve separately, and the order in which they resolve is almost perfectly reproducible between runs that share nothing but the task.
Result 2: what orders the staircase is not position
The per-position transition steps are not monotone in position: 40, 70, 95, 114, 54, 77, 91, 113, 74, 80, 88, 100, 79. "Later positions are harder" is simply false, and so is its opposite.
The script scores three candidate orderings rather than leaving the pattern to be spotted:
| Ordering | Spearman |
|---|---|
| Prefix element being predicted | +0.910 |
| Absolute position | +0.302 |
| Position within the period | -0.196 |
delayed-copy repeats a prefix of length lag, so position p predicts prefix element (p + 1) mod lag. Grouping by that makes the staircase obvious:
| Prefix element | Positions | Mean transition step |
|---|---|---|
| 0 | 3, 7, 11, 15 | 61.8 |
| 1 | 4, 8, 12 | 75.7 |
| 2 | 5, 9, 13 | 91.3 |
| 3 | 6, 10, 14 | 109.0 |
The model learns to reproduce the repeating prefix one element at a time, in order, roughly 16 steps apart. What looked like a single event is four, and the ordering is the sequence order of the thing being memorised.
Result 3: per lag, the same consistency without the separation
dispatch-copy-8lag, six lag classes:
| Measure | Value |
|---|---|
| Stagger between classes | 105.0 steps |
| A single class's own width | 251.5 steps |
| Stagger / width | 0.42 |
| Order consistency across seeds | +0.910 |
| Ordered by announced lag | -0.886 |
By the scale-free criterion this is not a staircase: each class takes so long to transition that the classes overlap heavily. It is a ramp with a consistent internal ordering rather than a set of discrete steps.
And the ordering is counterintuitive: rho = -0.886 against the announced lag means longer lags are acquired first. Lag 6 and 7 transition around steps 80 and 90; lags 2 and 3 around 162 and
- Whatever makes a short lookback easy for a human is not what makes it easy for this model.
What the two views agree on
The two decompositions disagree about whether to call it a staircase, and agree about the thing that matters more: the acquisition order is highly reproducible in both (+0.983 and +0.910). Whether the steps are separated enough to resolve depends on how wide each step is, which is a property of the task. The existence of a consistent order does not.
That is the internal structure the program lacked. Concretely:
- A11 gains a candidate. A12's own note says that if acquisition propagates, the earliest class is a candidate leading indicator for the full transition. It does propagate, reproducibly, and the earliest class transitions ~47 steps before the latest.
- A14 gains a handle. Position-dependent difficulty is real and ordered, so a curriculum over prefix elements is now a well-defined intervention rather than a guess.
- It complements F2 without duplicating it. F2 found information present in the state ~23 steps before the model can use it. This finds parts of the output arriving before other parts. Both are "early predicts late", measured on different objects.
Limits
- One architecture (GRU), one width, five seeds, two tasks.
- Both orderings are correlational. Nothing here shows that the early classes cause the late ones; a curriculum experiment or a per-class freeze would be needed, and D1's freeze machinery is the obvious tool.
- The
1.0threshold on stagger-over-width is a choice, made before the runs but not preregistered. The two tasks land at1.44and0.42, comfortably either side, so the verdict does not turn on a borderline call, but a task landing near1.0would need a better rule. - The dispatch task's six usable classes exclude lag 8, which did not clear the sample-count floor on every seed.
Terms on this page
Every piece of vocabulary this record uses, in plain language. Generated from the text above, so it cannot drift out of step with it.
- accuracy
- The fraction of answers a model gets right on questions it was not trained on.
- architecture
- The blueprint of a model: what components it has and how they connect. Two models can be the same size and completely different architectures.
- argmax
- Short for 'the argument that maximises'. A model outputs a score for every possible next token; the argmax is simply whichever one scored highest. Accuracy is measured on the argmax, which is why accuracy is a thresholded quantity: only the winner counts, and by how much it won is discarded.
- bits per token
- How surprised the model is by the correct answer, in the units used by compression. It is the training loss written a different way. Unlike accuracy it has no right-or-wrong threshold in it, so a gradual change in the model shows up as a gradual change in the number. Pure guessing on a 32-symbol vocabulary costs 5 bits per token.
- curriculum
- The order and mix in which a model is shown its training material, for example easy examples first and harder ones later.
- GRU
- Gated Recurrent Unit. A compact design for processing sequences one item at a time, with internal switches controlling what it keeps in memory.
- kill test
- A condition written down before running the experiment that says what result would make us abandon the idea. Fixing it in advance is what stops a disappointing result being reinterpreted as an encouraging one.
- reproducible
- Someone else running the same code on the same inputs gets the same numbers. Every result here is checked this way.
- seed
- The number that fixes all the randomness in a training run. Same seed, same run. Running several seeds is how you tell a real effect from a lucky one.
- width
- How many internal numbers a model uses at each layer. The usual way we vary model size in these experiments.
Get new results as we publish them
Roughly monthly, one finding per email, in plain English first. Including the approaches that turned out not to work, which are usually the useful ones. No sales email.
Double opt-in: we send a confirmation link and add nobody who does not click it. One-click unsubscribe on every email.