
Which Side of the Moment
Ongoing research. This is an experimental result from active work, not a settled conclusion. The numbers are what we measured and the method is described so you can judge it, but the programme is still running and later experiments may revise what it means.
A note on the language in these records. This is a working laboratory notebook for research into training AI models more cheaply and efficiently, so you will read that an approach did not work, that a result did not hold up, or that one method was worse than another. That is the research doing its job, not a verdict on the engineering we deliver to clients. Ruling an approach out is how the search narrows, and these are the pages that teach us the most: nearly every technique we now rely on came from understanding why something else fell short. Testing our own ideas at least as hard as anyone else's is the point of publishing them. More about this programme and why we run it.
Part of a bigger question: How do we know our own results are real? – Repeatedly, the control rather than the measurement decided the result -- and several striking findings dissolved when the right comparison was finally run.
In plain English
What we asked. We had a training shortcut: partway through, switch to a cheaper setting that processes less data per step. On smaller models it reached the target on 22% less data. Repeated on a model four times wider with a harder task, it cost 26% more instead. Something in that change had flipped it, and three things had changed at once: the model got bigger, the task got harder, and each cheap step carried less data to learn from. So we ran a grid that varied them separately.
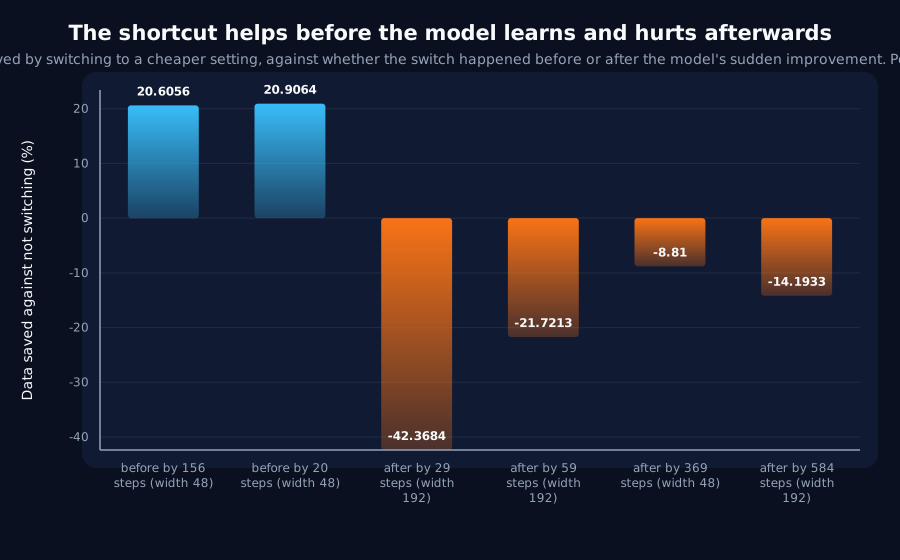
What we found. None of the three was responsible. What decides it is whether the switch happens before or after the moment the model suddenly improves. Every switch made before that moment saved about a fifth of the data. Every switch made after it cost between nine and forty-two per cent. One combination proves it on its own: the same model, the same task, the same data per step, switched at two different times, saving in one case and costing in the other. Model size does shift how good the outcome is, but it never flips it, and the amount of data per step decides nothing at all.
Why it matters. The uncomfortable part is what this says about the original result. We checked when the sudden improvement happened in those old runs: step 88. The signal we were using to decide when to switch fired at step 65 or 70, in every single run. So we had always been switching before the model learned, while explaining the saving with a story about how little work was left after it had learned. The saving was real and our account of it was on the wrong side of the event it named. The two results were never in conflict; they are two points on one curve, along an axis neither of them was varying.
The rest of this page is the technical record: the design, every number, and the limits. It is written for a reviewer, and you do not need it to have understood the result above.
New here? How to read a research record
- Start at the verdict. Every record states, before the experiment was run, what result would have made us abandon the idea. That is the "kill test". Then it says whether the test fired. Nothing gets reinterpreted after the fact.
- Numbers in square brackets are uncertainty.
23.4 [18.1, 28.7]means our best estimate is 23.4 and the true value is probably somewhere in that range. If a range includes zero, we cannot claim an effect. - Results that rule an idea out are kept. Roughly half of what is published here says an approach did not work, including plenty of our own. Those pages are the output, not a shortfall: knowing which direction is a dead end is what lets the next experiment go somewhere better, and most of what we now rely on came out of understanding why something else fell short. Work that only publishes what worked is not measuring anything.
- Read the Limits section. Every record ends with what it does not show. It is the most honest part of any experiment and usually the shortest.
- Pro tip: the figures near the top are designed to carry the result on their own. If you read nothing else, read the caption under each one, which says what it shows and what to take from it.
THIS RECORD'S HEADLINE IS WITHDRAWN. Q11 untied the confound this record named in its own verdict and found the sign decided by width, not by the side of the transition. See the correction at the end. What stands is the negative, scored tokens per step decide nothing, and the observation that J7 always switched before its transition.
EXPLORATORY. Not a preregistered study. Local CPU, 60 training runs, no GPU, no cost.
Program v2 Bucket Q, item Q8. Decisive computation: analysis/cut_reversal.pyanalysis/cut_reversal.jsonpython analysis/cut_reversal.py; --reuse re-derives every endpoint without retraining.
The question
Q1 found J7's batch cut reversing sign, a 22% saving in samples-to-target at width 48 on lag 4 became a 25.8% cost at width 192 on lag 11, and could not say why, because P12's matched ladder moves width and difficulty together by construction. A third candidate moves with them: scored tokens per step, which falls from 192 to 80 per cheap batch as the lag goes from 4 to 11.
So: a 2x2 of {width 48, 192} x {lag 4, lag 11}, control against a switched arm, two switch times per cell, samples-to-target at a matched sample budget. No probe, Q1 showed a single fixed step matches the probe's timing, so it would add cost and variance and answer nothing.
Kill test, fixed before execution: the cut still saves at width 192, lag 4.
The anchors hold
| Here | Q1 | |
|---|---|---|
w48-lag4 control | 10,944 [9,772, 12,116] | 11,080 [10,380, 11,780] |
w192-lag11 control | 74,176 [62,290, 86,062] | 74,176 [62,290, 86,062] |
w192-lag11 switched | 90,288 [81,574, 99,002] | 92,080 [85,936, 98,224] |
The middle row is identical rather than merely overlapping: same seeds, same code path.
The kill test does not fire, and it does not license the conclusion it was written for
The cut costs 42.4% at width 192 on lag 4, so by the letter of the preregistration the reversal is not "difficulty or scored tokens". But the grid does not say it is width either, and the reason is a confound of my own making: the switch is fixed at a fraction of the budget while the transition moves with width, so this design ties width to which side of the transition the switch lands on.
Two of the eight arms carry no information at all: their switch fell after the run had already reached the target, making them identical to the control rather than a null. They are excluded. The six that remain:
| Cell | Switch vs its own transition | Scored tokens | Change |
|---|---|---|---|
w48-lag11 | -156 | 80 | +20.6% |
w48-lag4 | -20 | 192 | +20.9% |
w192-lag4 | +29 | 192 | -42.4% |
w192-lag11 | +59 | 80 | -21.7% |
w48-lag11 | +369 | 80 | -8.8% |
w192-lag11 | +584 | 80 | -14.2% |
Every arm that switched before its own transition saved. Every arm that switched after it cost. Six for six.
- Scored tokens per step decide nothing.
192gives+20.9%and-42.4%;80gives+20.6%and three negatives. The hypothesis a practitioner would reach for first is dead. - Width does not decide the sign. Width 48 produces
+20.6%,+20.9%and-8.8%. - Width does order the effect, and that is real: every width-48 arm sits above every width-192 arm (
-8.8%against-14.2%at the join). Wider is worse at any given side. It is just not what reverses the manoeuvre.
One cell settles it on its own. w48-lag11, transition at 381: cut at 225 gives +20.6%, cut at 750 gives -8.8%. Same width, same task, same scored tokens, same budget, same seeds. Only the side of the transition differs, and the sign flips.
What this does to J7
J7's control transition, measured here on J7's own configuration and seeds, is step 88. J7's probe crossed at 65 or 70, in all eight seeds.
J7 always switched before the transition. Its 22% saving is the "before" effect, and its random-timed control drew from the same crossing distribution, so that arm switched before the transition too, which is exactly why the two matched.
And J7's stated mechanism was on the wrong side of its own event. Its reasoning was that at the probe's crossing "the answer is already linearly present in the hidden state and the head has not yet learned to read it", so the remaining work is cheap. That is a post-transition story about a switch that was consistently pre-transition.
Q1's crossings, 140 to 200 with a mean of 165 against a transition at 166, sit on the transition, which is why Q1 found no saving there. The two results are one curve, not a contradiction, and the axis is the one neither of them was varying.
Verdict
- The kill test's literal outcome is reported as a failure, and separately from the conclusion, because a test whose grid ties two explanations together has not distinguished them. This is the same discipline P12's third case used.
- Scored tokens per step are ruled out. That is a clean negative on the most obvious hypothesis.
- Side of the transition explains all six arms; width explains none of the sign and all of the ordering.
- A follow-up is needed and is cheap: switch at a fixed offset from each cell's own transition, which unties the two axes. Logged as Q11.
Limits
- Two "before" arms against four "after". The split is 6 for 6 but the positive side rests on two cells, and the strong evidence is the within-cell pair in
w48-lag11rather than the tally. Q11 is the confirmation. - The transition is one of Q2's fourteen definitions:
block_the_wrong_algorithm's, imported rather than re-implemented so no fifteenth is created. Q7's rule applies: the offsets here are4to117evaluation intervals from the transition, so none is inside the undecided band. - Five seeds per arm. One
w192-lag11run at the earlier switch finished at0.4517after reaching the target, so the cheap batch can destabilise a converged model on the harder task. That affects final accuracy, not samples-to-target, which is the endpoint here. - The two excluded arms are excluded on a structural fact, not a threshold: their switch step is later than the step at which the control reached the target, so those runs are the control.
- One manoeuvre, one cut ratio, one crossing level, one task family. As in J7 and Q1, the
4xcut was fixed in advance and never swept, so "cutting the batch before the transition helps" is a statement about this cut.
CORRECTION (2026-09-01, v0.147.0): the headline is withdrawn. It was width.
Q11 ran the follow-up this record asked for, the switch placed at a multiple of each run's own transition, at two widths on one task, so difficulty and scored tokens are held fixed and width varies independently of the side.
The sign differs by width at three of the four matched multiples:
| Multiple of the run's own transition | Width 48 | Width 192 |
|---|---|---|
x0.5 (before) | +25.5% | -46.3% |
x0.8 (before) | +19.9% | -42.0% |
x1.25 (after) | +9.4% | -33.3% |
x2.0 (after) | -1.9% | -53.4% |
Side of the transition does not decide the sign. Width does, including at x1.25, clearly after the transition, where width 48 still saves +9.4%.
The six-for-six pattern below is real and is a slope, not a step. At width 48 the benefit decays smoothly with lateness and crosses zero around twice the transition, with no discontinuity anywhere near it. This record's own within-cell pair: w48-lag11, +20.6% at roughly x0.6 and -8.8% at roughly x1.97, is two points on that slope. Q11 reproduces both ends at width 48 (+19.9% at x0.8, -1.9% at x2.0).
The preregistered kill test below was right and I overrode it. It asked whether the cut still saves at width 192 on lag 4; it did not, at -42.4%, which points straight at width. I reported that and then argued it did not license its conclusion because the grid tied width to side-of-the-transition. That objection was true, and it applied just as much to the explanation I preferred, which I did not check. A post-hoc pattern that explains every point in a small confounded grid is the most likely thing such a grid produces.
What survives unchanged: scored tokens per step decide nothing, and the observation about J7, that its probe crossed at 65-70 against a transition of 88, so it always switched before it, is a fact and stays. What does not survive is the claim that that is why it saved.
Terms on this page
Every piece of vocabulary this record uses, in plain language. Generated from the text above, so it cannot drift out of step with it.
- accuracy
- The fraction of answers a model gets right on questions it was not trained on.
- confound
- A second explanation you did not control for. If bigger models both learn faster and score higher, then 'fast learners score higher' may be entirely about size and not about speed.
- evaluation interval
- The gap between successive checks of a model during training. It is the smallest difference in timing a measurement can resolve, so two results closer together than one interval cannot be told apart.
- hidden state
- The model's working memory: the internal numbers it carries from one step of a sequence to the next.
- kill test
- A condition written down before running the experiment that says what result would make us abandon the idea. Fixing it in advance is what stops a disappointing result being reinterpreted as an encouraging one.
- post hoc
- Worked out after the fact, rather than decided in advance. We report such checks separately and never let them decide a result, because it is far too easy to find a pattern once you already know the answer.
- preregistration
- Writing down the design, the measurement and the decision rule before running the experiment, and not changing them afterwards.
- probe
- A small separate model trained to read information out of a bigger model's internals, used as a measuring instrument rather than as a product.
- seed
- The number that fixes all the randomness in a training run. Same seed, same run. Running several seeds is how you tell a real effect from a lucky one.
- slope
- How steeply one quantity changes as another does. A slope of one between a warning and the event it predicts means the warning shifts exactly in step with the event.
- variance
- How spread out a set of numbers is. Rising variance in a signal means it is becoming more erratic.
- width
- How many internal numbers a model uses at each layer. The usual way we vary model size in these experiments.
Get new results as we publish them
Roughly monthly, one finding per email, in plain English first. Including the approaches that turned out not to work, which are usually the useful ones. No sales email.
Double opt-in: we send a confirmation link and add nobody who does not click it. One-click unsubscribe on every email.