
The Edge Shrank With More Models
Ongoing research. This is an experimental result from active work, not a settled conclusion. The numbers are what we measured and the method is described so you can judge it, but the programme is still running and later experiments may revise what it means.
A note on the language in these records. This is a working laboratory notebook for research into training AI models more cheaply and efficiently, so you will read that an approach did not work, that a result did not hold up, or that one method was worse than another. That is the research doing its job, not a verdict on the engineering we deliver to clients. Ruling an approach out is how the search narrows, and these are the pages that teach us the most: nearly every technique we now rely on came from understanding why something else fell short. Testing our own ideas at least as hard as anyone else's is the point of publishing them. More about this programme and why we run it.
Part of a bigger question: How much model does a task need, and what changes when it has more? – The abrupt jump is what spare capacity buys -- it fades smoothly as the model shrinks, long before the model stops working. Capacity and task difficulty act separately, not as a ratio.
In plain English
What we asked. A few hours earlier we published a finding: when small models are rounded down to fewer digits to save memory, measuring their internal shape picked out the badly damaged ones three times better than simply measuring how much their numbers changed. We had only twelve models, and said so. So we ran it again with forty-eight.
What we found. Most of the three-fold edge disappeared. The internal-shape measure is still somewhat better where the damage is heavy, but not by enough to be sure. What changed was the simpler measure: on twelve models it had happened to do unusually badly, and with more models it recovered. Measuring the internal shape further from the output made it worse, not better.
Why it matters. The earlier page now carries a note at the top saying so; we do not rewrite published results, we add corrections. The general lesson is an old one worth repeating: with a small sample, one of two similar measures can look far better than the other by luck, and a dramatic ratio between them is the first thing to recheck.
The rest of this page is the technical record: the design, every number, and the limits. It is written for a reviewer, and you do not need it to have understood the result above.
New here? How to read a research record
- Start at the verdict. Every record states, before the experiment was run, what result would have made us abandon the idea. That is the "kill test". Then it says whether the test fired. Nothing gets reinterpreted after the fact.
- Numbers in square brackets are uncertainty.
23.4 [18.1, 28.7]means our best estimate is 23.4 and the true value is probably somewhere in that range. If a range includes zero, we cannot claim an effect. - Results that rule an idea out are kept. Roughly half of what is published here says an approach did not work, including plenty of our own. Those pages are the output, not a shortfall: knowing which direction is a dead end is what lets the next experiment go somewhere better, and most of what we now rely on came out of understanding why something else fell short. Work that only publishes what worked is not measuring anything.
- Read the Limits section. Every record ends with what it does not show. It is the most honest part of any experiment and usually the shortest.
- Pro tip: the figures near the top are designed to carry the result on their own. If you read nothing else, read the caption under each one, which says what it shows and what to take from it.
EXPLORATORY. Not a preregistered study. Local CPU, forty-eight models. The design and kill test were committed (bce0717) and the pilot (b106a82) before any run.
Program v2 Bucket S, item S12. Decisive computation: analysis/quantisation_detector.pyanalysis/quantisation_detector.jsonpython analysis/quantisation_detector.py (about half an hour on a throttled laptop CPU); --reuse re-derives every endpoint from the saved measurements.
The question
S5 quantised twelve small models and found that, within a bit width, CKA to the full-precision model ranked accuracy loss three times better than plain weight error (mean |rho| 0.481 against 0.154) -- and flagged in its own text that only the 2-bit correlation was individually convincing at twelve models, that at 4 bits both had the wrong sign, and that the representation measured sat one linear map from the output. S5's reading was that geometry is a label-free diagnostic of damage.
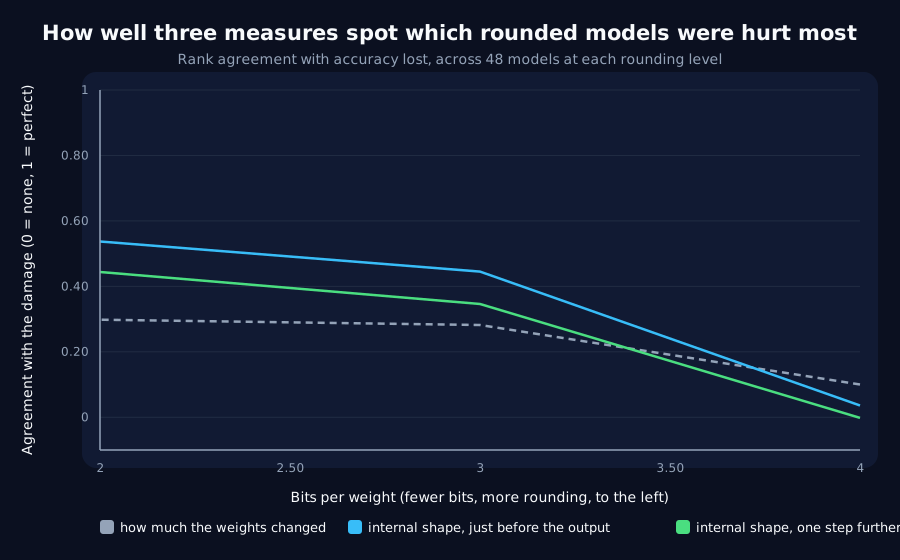
S12 powers that claim and moves it inward: forty-eight models, CKA on the readout's input as in S5 and on the pre-normalisation recurrent state, one step further from the output, and a bootstrap over models of each geometry measure's rank correlation minus weight error's.
Kill test, fixed before execution: at 3 bits, neither representation's within-bit rank correlation with accuracy lost exceeds weight error's with a bootstrap interval excluding zero.
Prior recorded in advance: moderate for the readout input, low for the inner state.
Anchor, in code, passed exactly: the first twelve models are S5's, and their 3-bit CKA reproduces S5's committed values with a largest difference of 0.
Result: the kill test fires
Within each bit width, across forty-eight models, rank correlation with accuracy lost:
| Bits | Mean loss | Weight error | CKA, readout input | CKA, inner state | Readout minus weight | Inner minus weight |
|---|---|---|---|---|---|---|
4 | 0.013 | +0.100 | +0.036 | -0.002 | -0.068 [-0.504, +0.369] | -0.104 [-0.538, +0.330] |
3 | 0.114 | +0.282 | +0.445 | +0.346 | +0.160 [-0.196, +0.521] | +0.063 [-0.312, +0.447] |
2 | 0.767 | +0.298 | +0.537 | +0.444 | +0.242 [-0.045, +0.525] | +0.149 [-0.171, +0.453] |
At 3 bits geometry still ranks the damage better than weight error, by 0.160, and the interval runs from -0.196 to +0.521. At 2 bits the advantage is larger and still includes zero. The inner state is weaker than the readout input at every width.
What changed from S5, and why
Weight error's correlation roughly quadrupled with more models -- +0.07 at 3 bits on S5's twelve, +0.28 on forty-eight -- while geometry's stayed near where it was (+0.40 to +0.45). S5's headline ratio was carried largely by weight error's weak showing on twelve models, which was noise. The direction survives; the size does not, and neither does the confidence.
This is the pattern this programme has seen before under other names: a small sample can make one of two correlated measures look dramatically better than the other, and the gap is mostly the smaller measure's noise. Twelve models is enough to see a direction and not enough to rank two diagnostics.
Further from the output is weaker, not stronger. The pre-normalisation state is one step removed from the logits and ranks the damage less well at every width -- consistent with S5's concern that the readout input was close to measuring the output directly, and the opposite of what a "geometry sees something the output does not" story would need.
What stands
- The kill test fires. With forty-eight models, neither geometry measure's advantage over weight error at
3bits excludes zero (+0.160[-0.196, +0.521]for the readout input). - S5 is qualified by banner. Its direction reproduces -- geometry ranks damage somewhat better than weight error at
2and3bits -- but its "three times better" was mostly twelve-model noise. - The closer to the output, the better the diagnostic, which is what a measure that works by approximating the output would do.
- S5's other finding is untouched: a repair restores accuracy without restoring the geometry. That was a measurement of means with tight intervals, not a ranking.
Limits
- One quantisation scheme, one task, one width. A scheme that damages models unevenly -- mixed precision, importance-weighted scales -- could spread the losses more and make ranking easier.
- Rank correlation across models of one width is a hard test by design, because the models differ little; the diagnostic question in practice is often across checkpoints or schemes, where the differences are larger.
- The bootstrap resamples models, which is the unit that varied (R15's rule), with
2000resamples and a fixed seed.
Terms on this page
Every piece of vocabulary this record uses, in plain language. Generated from the text above, so it cannot drift out of step with it.
- accuracy
- The fraction of answers a model gets right on questions it was not trained on.
- bootstrap
- A way of estimating how uncertain a number is by repeatedly resampling the data you already have. Useful when the usual formulas do not apply.
- checkpoint
- A saved copy of a model partway through training, so you can come back and inspect what it looked like at that moment.
- CKA
- Centred kernel alignment: a score from 0 to 1 for how similar two sets of internal model activity are, where 1 means the same up to rotation and scale.
- kill test
- A condition written down before running the experiment that says what result would make us abandon the idea. Fixing it in advance is what stops a disappointing result being reinterpreted as an encouraging one.
- logits
- The raw scores a model produces for each possible answer before they are turned into probabilities.
- normalisation
- Dividing a measurement by something else to make it comparable across cases. What you divide by is a choice, and it can change the answer as much as the data does.
- quantisation
- Rounding a model's numbers to fewer bits so it takes less memory and runs on smaller hardware, at some cost in accuracy. Spelled quantization in US usage.
- rank
- How many independent directions a set of numbers really uses. A low-rank structure is one that looks high-dimensional but is actually simple underneath.
- recurrent
- A design that reads a sequence one item at a time, carrying memory forward. The main alternative is attention, which looks at everything at once.
- seed
- The number that fixes all the randomness in a training run. Same seed, same run. Running several seeds is how you tell a real effect from a lucky one.
- width
- How many internal numbers a model uses at each layer. The usual way we vary model size in these experiments.
Get new results as we publish them
Roughly monthly, one finding per email, in plain English first. Including the approaches that turned out not to work, which are usually the useful ones. No sales email.
Double opt-in: we send a confirmation link and add nobody who does not click it. One-click unsubscribe on every email.