
Consolidation Is a Measurement-Frame Effect
Ongoing research. This is an experimental result from active work, not a settled conclusion. The numbers are what we measured and the method is described so you can judge it, but the programme is still running and later experiments may revise what it means.
A note on the language in these records. This is a working laboratory notebook for research into training AI models more cheaply and efficiently, so you will read that an approach did not work, that a result did not hold up, or that one method was worse than another. That is the research doing its job, not a verdict on the engineering we deliver to clients. Ruling an approach out is how the search narrows, and these are the pages that teach us the most: nearly every technique we now rely on came from understanding why something else fell short. Testing our own ideas at least as hard as anyone else's is the point of publishing them. More about this programme and why we run it.
Part of a bigger question: How do we know our own results are real? – Repeatedly, the control rather than the measurement decided the result -- and several striking findings dissolved when the right comparison was finally run.
In plain English
What we asked. We had reported, for about a year, that a model's internal state expands while it learns something and then settles back down. This was a check on whether the settling is real.
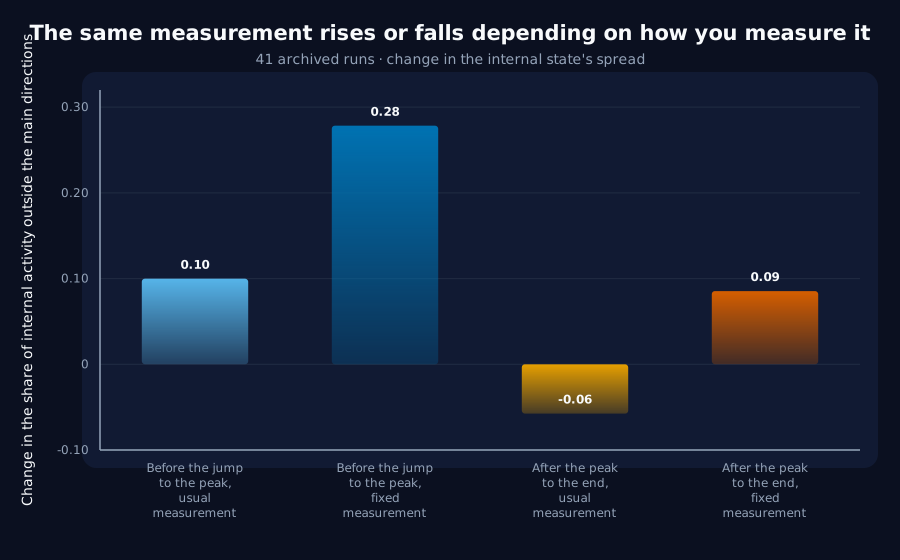
What we found. It is not. The number appeared to fall only because the ruler we measured it with was moving too. Hold the ruler still and the same 41 experiments show the number rising, nearly three times more than we thought it rose in the first place. Nothing contracts.
Why it matters. This is our own result being overturned by our own check, which is the point of running checks. The general lesson is worth more than the specific one: if your measuring instrument is derived from the thing you are measuring, it can manufacture a trend out of nothing at all.
The rest of this page is the technical record: the design, every number, and the limits. It is written for a reviewer, and you do not need it to have understood the result above.
New here? How to read a research record
- Start at the verdict. Every record states, before the experiment was run, what result would have made us abandon the idea. That is the "kill test". Then it says whether the test fired. Nothing gets reinterpreted after the fact.
- Numbers in square brackets are uncertainty.
23.4 [18.1, 28.7]means our best estimate is 23.4 and the true value is probably somewhere in that range. If a range includes zero, we cannot claim an effect. - Results that rule an idea out are kept. Roughly half of what is published here says an approach did not work, including plenty of our own. Those pages are the output, not a shortfall: knowing which direction is a dead end is what lets the next experiment go somewhere better, and most of what we now rely on came out of understanding why something else fell short. Work that only publishes what worked is not measuring anything.
- Read the Limits section. Every record ends with what it does not show. It is the most honest part of any experiment and usually the shortest.
- Pro tip: the figures near the top are designed to carry the result on their own. If you read nothing else, read the caption under each one, which says what it shows and what to take from it.
EXPLORATORY. Not a preregistered study. No new experiments, no training, no GPU, no cost. Reads only the committedresults/bundles, the captured activation tensors inanalysis/representations.ptand the final output head incheckpoint.pt.
Program v2 tier 0, item D6. Decisive computation: analysis/consolidation_fate.pyanalysis/consolidation_fate.jsonpython analysis/consolidation_fate.py in about two minutes on CPU.
The question
The confirmed phenomenon is that rank-r residual energy rises about 50% around the accuracy transition and then falls back. The rise has been measured five ways. The fall, the thing this project has been calling consolidation, has never been decomposed. Three fates were posed in the backlog, each meaning something different:
- Decay, the expanded directions lose their energy. The expansion was transient activity.
- Rotation into the read subspace, the expanded directions become the ones the head reads. The expansion is where the solution gets built.
- Persistence as unused variance, the energy stays and the head keeps ignoring it.
The answer is none of the three. It is a fourth thing the backlog did not anticipate, and it changes what the word "consolidation" can be used for.
Method
For each of the 41 eligible task-only delayed-copy runs (all 41 qualified), take the final_norm capture at the step where residual energy peaks and freeze the tail subspace at the peak: the orthogonal complement of the top-r principal subspace, which is exactly the subspace whose energy share the confirmed rise measures. Then follow that fixed frame to the last capture.
Every quantity here has a nonzero chance value, a random (W - r)-dimensional frame already captures (W - r)/W = 0.8333 of any fixed direction, so two controls run alongside:
- a random-subspace calibration, which came back at
0.8334[0.8284, 0.8384], confirming the analytic chance level empirically; - a random-time-matched control, in the spirit of this program's standing rule: the same measurements on a tail frozen at a randomly chosen other capture step.
Only task-only runs are analysed; a penalised run drives residual energy through its own loss, which would manufacture the structure being looked for.
Result 1: the fall is a frame rotation, not a contraction
Between the peak capture and step 500, measured inside the frozen peak-tail frame:
| Quantity | Peak → final | Runs favourable |
|---|---|---|
| Energy inside the frozen peak tail | x2.1776 [2.0181, 2.3371] | 41 / 41 |
| Energy in its complement (the peak's retained subspace) | x1.5096 [1.4567, 1.5625] | 41 / 41 |
| Total representation energy | x1.8297 [1.7328, 1.9266] | 41 / 41 |
The expanded directions do not decay. They gain energy after the peak, and they gain it faster than the subspace that was being retained. Consequently the frozen tail's share of total energy rises from 0.4808 at the peak to 0.5662 at the end, in 40 of 41 runs.
Meanwhile, measured in each capture's own moving basis, the way every previous analysis in this project measured it, residual share falls from 0.4808 to 0.4233, in 41 of 41 runs.
Both statements are true of the same runs. The reconciliation is that the top-r subspace is not a fixed set of directions: it is redefined at every capture as whichever r directions currently hold the most energy. After the peak, that redefinition captures more of the still-growing energy than it did before.
The post-peak fall in residual energy is the retained subspace rotating, not the expansion unwinding. Nothing contracts.
Result 2: the rise is real, and larger than reported
The same frozen-frame test applied to the rise gives the opposite verdict, which is what makes the first result credible rather than an artifact of the method:
| Pre-transition capture → peak | Share change |
|---|---|
| In each capture's own moving basis | +0.0998 [+0.0847, +0.1149] |
| In a frame frozen at the pre-transition capture | +0.2783 [+0.2489, +0.3077] |
Energy genuinely moves into those directions across the transition, by 2.8x more than the moving-basis measurement shows, because the moving basis chases the energy and so understates it. The confirmed rise is not weakened by this analysis; it is strengthened.
Result 3: the head under-reads the tail, but not because of the peak
Measure (chance = 0.8333) | Value | Runs above chance |
|---|---|---|
| Peak tail's alignment with the output head | 0.6093 [0.5935, 0.6251] | 0 / 41 |
| Peak tail's overlap with the final retained subspace | 0.4164 [0.3824, 0.4504] | 0 / 41 |
| Random subspace, same measure (calibration) | 0.8334 [0.8284, 0.8384] | 20 / 41 |
The output head systematically under-reads the expanded tail, and the final retained subspace sits mostly inside what was already retained at the peak. So fate 2, rotation into the read subspace, is excluded: the expanded directions do not become the ones the head reads.
But this is not a property of the peak. Against the random-time-matched control, paired within run:
| Paired difference (peak frame − random-time frame) | Mean | 95% interval | Material? |
|---|---|---|---|
| Head alignment | +0.0060 | [-0.0431, +0.0552] | no |
| Overlap with final retained subspace | +0.0759 | [-0.0230, +0.1748] | no |
A tail frozen at an arbitrary capture behaves the same way. "The head reads the top of the spectrum and ignores the tail" is a standing fact about these runs, not something the transition creates.
Verdict against the kill test
The kill test was "no consistent post-peak structure across the 41 archived task-only runs." Structure is consistent: 41/41 on all three energy ratios, 40/41 on the frozen-share rise, 0/41 above chance on both subspace measures. D6 is not killed. But the structure found is not specific to the peak, and it reinterprets rather than explains the fall.
What this costs the program
- A2 (consolidation onset as a stopping criterion) is undermined. Its signal is the post-peak fall, and that fall is a property of the measurement frame rather than an event in the representation. A2 should either be re-specified against a frame-fixed quantity or dropped. As written, it would be detecting the top-
rsubspace catching up with the energy. - Any use of the word "consolidation" now needs a frame. The term entered this project from the moving-basis curve. In a fixed frame nothing consolidates.
- The confirmed rise is unaffected and understated. It should be re-quoted in fixed-frame terms in any future write-up.
Limits
- Captures are every 50 steps, so the peak is located on a coarse grid: peak-minus-transition offsets span
-10to+110, against the+14.1the 10-stepmetrics.csvgrid gives. The frozen-frame conclusions do not depend on peak placement, a random-time frame shows the same pattern, but the peak itself is imprecise here. D0 (mid-run checkpoints) would fix this. - Only the final output head is archived. Head alignment is therefore measured with the end-of-training head at every frozen time. That is the right question for "did these directions become read?", but it cannot say what the head was reading at the peak. Also fixed by D0.
- One architecture (
tiny-gru), one task (synthetic-delayed-copy-v1), one optimizer (AdamW), one learning rate. D8 and E3 still scope all of it.
Terms on this page
Every piece of vocabulary this record uses, in plain language. Generated from the text above, so it cannot drift out of step with it.
- accuracy
- The fraction of answers a model gets right on questions it was not trained on.
- AdamW
- A widely used training algorithm that adapts how big a step it takes for each individual parameter. The default in most modern AI training.
- architecture
- The blueprint of a model: what components it has and how they connect. Two models can be the same size and completely different architectures.
- calibration
- Working out an instrument's settings from runs whose answer you already know, so it can be used on a run whose answer you do not.
- checkpoint
- A saved copy of a model partway through training, so you can come back and inspect what it looked like at that moment.
- GRU
- Gated Recurrent Unit. A compact design for processing sequences one item at a time, with internal switches controlling what it keeps in memory.
- kill test
- A condition written down before running the experiment that says what result would make us abandon the idea. Fixing it in advance is what stops a disappointing result being reinterpreted as an encouraging one.
- learning rate
- How big a step training takes each time it updates the model. Too small and nothing happens; too big and it never settles.
- optimizer
- The algorithm that decides how to change the model given the gradient. AdamW and SGD are two common choices and they behave differently.
- rank
- How many independent directions a set of numbers really uses. A low-rank structure is one that looks high-dimensional but is actually simple underneath.
- residual
- How far the data sits from a proposed description of it, after the description has been fitted as well as it can be. A small residual means the description accounts for what was measured; a large one means something is missing.
- residual energy
- Our measure of how much of a model's internal activity is left over after accounting for its few strongest directions. High means the activity is spread out; low means it is concentrated.
- subspace
- A slice of a model's internal space: some directions kept, the rest ignored.
- variance
- How spread out a set of numbers is. Rising variance in a signal means it is becoming more erratic.
Get new results as we publish them
Roughly monthly, one finding per email, in plain English first. Including the approaches that turned out not to work, which are usually the useful ones. No sales email.
Double opt-in: we send a confirmation link and add nobody who does not click it. One-click unsubscribe on every email.